
In this tutorial, we will cover the steps needed for installing ELK Stack on Ubuntu 18.04.
 The ELK Stack is a combination of four open-source tools which together form a log management tool. The ELK Stack is a platform that helps in deep searching, analyzing, and visualizing the log generated from different machines. The install process is straightforward, so let’s begin. First though, we will go over a few key details regarding what makes up an ELK stack.
The ELK Stack consists of four main parts:
Elasticsearch: is a tool which plays a major role in storing the logs in the JSON format, indexing it and allowing the searching of the logs. One of the important features of the Elasticsearch are:
- It is a search engine/search server.
- It is a NoSQL-based database. It means that Elasticsearch doesn’t use SQL for queries.
- It is based on Apache Lucene and provides the RESTful API.
- It uses indexes to search, which makes it faster.
Logstash: is an open-source tool which used to collect, parse and filter system logs as the input. One of the important features of the Logstash are:
- It is a data pipeline tool
- Centralizes the data processing
- Collects, parses and analyzes a large variety of structured/unstructured data and events.
Kibana: is a web interface which allows us to search, display, and compile the data. A few of the more important features of Kibana are:
- Visualization tool.
- Provides real-time analysis, summarization, charting and debugging capabilities.
- Provides instinctive and user-friendly interface.
- Allows sharing of snapshots of the logs searched through.
- Permits saving the dashboard and managing multiple dashboards.
Beats: are used to collect data from various sources and transport them to Logstash or Elasticsearch.
Requirements:
- For the purposes of this tutorial, we will use an Ubuntu 18.04 Cloud VPS.
- Full SSH root access or a user with sudo privileges is also required.
Step 1 – Installing and Configuring Elasticsearch
First, update the system:
sudo apt-get update
Before installing Elasticsearch, we need to install Java 8. Elasticsearch requires Java 8. It is recommended to use the Oracle JDK 1.8.
sudo apt-get install python-software-properties software-properties-common apt-transport-https
sudo add-apt-repository ppa:webupd8team/java
Now, we will install the java8-installer:
sudo apt-get install oracle-java8-installer
After the installation, check the java version:
java -version
java version "1.8.0_201"
Java(TM) SE Runtime Environment (build 1.8.0_201-b09)
Java HotSpot(TM) 64-Bit Server VM (build 25.201-b09, mixed mode)
After installing Java, we will import the Elasticsearch public GPG key into APT and add the elastic repository to the system:
wget -qO - <span class="skimlinks-unlinked">https://artifacts.elastic.co/GPG-KEY-elasticsearch</span> | sudo apt-key add -
echo "deb <span class="skimlinks-unlinked">https://artifacts.elastic.co/packages/6.x/apt</span> stable main" | sudo tee -a /etc/apt/<span class="skimlinks-unlinked">sources.list.d/elastic-6.x.list</span>
We will update the repository and install the Elasticsearch package:
apt-get update
apt-get install elasticsearch
After the Elasticsearch installation is complete, we will go to /etc/elasticsearch directory and edit the configuration file ‘elasticsearch.yml’.
cd /etc/elasticsearch/
nano <span class="skimlinks-unlinked">elasticsearch.yml</span>
We will uncomment the ‘network.host’ line and change the value to ‘localhost’, and uncomment the default port for elasticsearch ‘http.port’:
<span class="skimlinks-unlinked">network.host</span>: localhost
<span class="skimlinks-unlinked">http.port</span>: 9200
Save the file and close it.
Now, we will start the Elasticsearch service and enable it.
systemctl start elasticsearch
systemctl enable elasticsearch
We will test our Elasticsearch service by sending an HTTP request:
curl -X GET "localhost:9200"
If your Elasticsearch service is up and running you will get some basic information about your local node, similar to this:
{
 "name" : "yeIWhmj",
 "cluster_name" : "elasticsearch",
 "cluster_uuid" : "2e6vC_sITGeT-PLy2r1UZA",
 "version" : {
 "number" : "6.6.0",
 "build_flavor" : "default",
 "build_type" : "deb",
 "build_hash" : "a9861f4",
 "build_date" : "2019-01-24T11:27:09.439740Z",
 "build_snapshot" : false,
 "lucene_version" : "7.6.0",
 "minimum_wire_compatibility_version" : "5.6.0",
 "minimum_index_compatibility_version" : "5.0.0"
 },
 "tagline" : "You Know, for Search"
}
We successfully installed and configured Elasticsearch.
Step 2 – Installing and Configuring Kibana
We already added the Elastic package source in the previous step, so now we will install the Kibana Dashboard and configure the Kibana service to run on the localhost address.
apt install kibana
Next, we will edit the configuration file ‘kibana.yml’.
cd /etc/kibana/
nano <span class="skimlinks-unlinked">kibana.yml</span>
We will uncomment the ‘server.port’, ‘server.host’, and ‘elasticsearch.hosts’
<span class="skimlinks-unlinked">server.port</span>: 5601
<span class="skimlinks-unlinked">server.host</span>: "localhost"
<span class="skimlinks-unlinked">elasticsearch.hosts</span>: ["http://localhost:9200"]
Save the file and close it.
Now, we will start the Kibana service and enable it.
systemctl enable kibana
systemctl start kibana
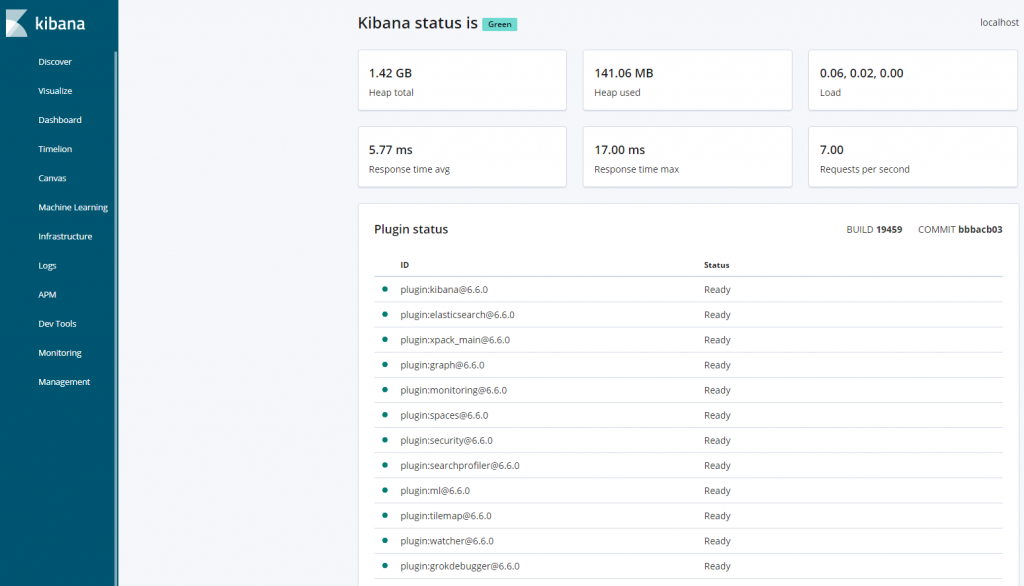
The Kibana dashboard is now up and running on the ‘localhost’ address and the default port ‘5601’.
We successfully installed and configured Kibana.
To access the Kibana dashboard we will be using the Nginx web server as a reverse proxy.
Step 3 – Installing Nginx
Run the following command to install the Nginx web server:
apt install nginx apache2-utils
We need to disable the default Nginx configuration file and create a new virtual host file for the Kibanba dashboard.
cd /etc/nginx/sites-available
rm /etc/nginx/sites-enabled/default
Create a new file Kibana and paste the following information:
server {
 listen 80;
 server_name <span style="color: #ff0000;">ip_address</span>;

 auth_basic "Restricted Access";
 auth_basic_user_file /etc/nginx/.htpasswd;

 location / {
 proxy_pass http://localhost:5601;
 proxy_http_version 1.1;
 proxy_set_header Upgrade $http_upgrade;
 proxy_set_header Connection 'upgrade';
 proxy_set_header Host $host;
 proxy_cache_bypass $http_upgrade;
 }
}
Don’t forget to replace “ip_address” with your server’s IP address. Save and exit.
For security reasons, we will create a new basic authentication web server for accessing the Kibana dashboard.
htpasswd -c /etc/nginx/.htpasswd elastic
Type the elastic user password.
Now we will activate the Kibana virtual host and test the Nginx configuration:
ln -s /etc/nginx/sites-available/kibana /etc/nginx/sites-enabled/
nginx -t
If the nginx configuration is Ok, run the following commands:
systemctl enable nginx
systemctl restart nginx
Now Kibana is accessible via your public IP address. Open your web browser and type:
http://<span style="color: #ff0000;">your_server_ip</span>/status
You will be prompted to enter the username and password which we created previously. After successful login, you can access the Kibana dashboard.
Step 4 – Installing and Configuring Logstash
We will use Logstash to centralize server logs from client sources. It is possible to use Beats to send data directly to the Elasticsearch database, but it is recommended using Logstash to process the data.
Install Logstash with the following command:
apt-get install logstash
Logstash has three main components:
- Input
- Filter
- Output
We will create a file called “02-beats-input.conf” and set up Filebeat input:
nano /etc/logstash/conf.d/02<span class="skimlinks-unlinked">-beats-input.conf</span>
Insert the following input configuration.
input {
 beats {
 port => 5044
 }
}
Next, we will create a file for filtering system logs, also known as syslogs.
nano /etc/logstash/conf.d/10<span class="skimlinks-unlinked">-syslog-filter.conf</span>
Insert the following system log for the filter configuration.
filter {
if [fileset][module] == "system" {
if [fileset][name] == "auth" {
grok {
match => { "message" => ["%{SYSLOGTIMESTAMP:[system][auth][timestamp]} %{SYSLOGHOST:[system][auth][hostname]} sshd(?:\[%{POSINT:[system][auth][pid]}\])?: %{DATA:[system][auth][ssh][event]} %{DATA:[system][auth][ssh][method]} for (invalid user )?%{DATA:[system][auth][user]} from %{IPORHOST:[system][auth][ssh][ip]} port %{NUMBER:[system][auth][ssh][port]} ssh2(: %{GREEDYDATA:[system][auth][ssh][signature]})?",
"%{SYSLOGTIMESTAMP:[system][auth][timestamp]} %{SYSLOGHOST:[system][auth][hostname]} sshd(?:\[%{POSINT:[system][auth][pid]}\])?: %{DATA:[system][auth][ssh][event]} user %{DATA:[system][auth][user]} from %{IPORHOST:[system][auth][ssh][ip]}",
"%{SYSLOGTIMESTAMP:[system][auth][timestamp]} %{SYSLOGHOST:[system][auth][hostname]} sshd(?:\[%{POSINT:[system][auth][pid]}\])?: Did not receive identification string from %{IPORHOST:[system][auth][ssh][dropped_ip]}",
"%{SYSLOGTIMESTAMP:[system][auth][timestamp]} %{SYSLOGHOST:[system][auth][hostname]} sudo(?:\[%{POSINT:[system][auth][pid]}\])?: \s*%{DATA:[system][auth][user]} :( %{DATA:[system][auth][sudo][error]} ;)? TTY=%{DATA:[system][auth][sudo][tty]} ; PWD=%{DATA:[system][auth][sudo][pwd]} ; USER=%{DATA:[system][auth][sudo][user]} ; COMMAND=%{GREEDYDATA:[system][auth][sudo][command]}",
"%{SYSLOGTIMESTAMP:[system][auth][timestamp]} %{SYSLOGHOST:[system][auth][hostname]} groupadd(?:\[%{POSINT:[system][auth][pid]}\])?: new group: name=%{DATA:<span class="skimlinks-unlinked">system.auth.groupadd.name</span>}, GID=%{NUMBER:<span class="skimlinks-unlinked">system.auth.groupadd.gid</span>}",
"%{SYSLOGTIMESTAMP:[system][auth][timestamp]} %{SYSLOGHOST:[system][auth][hostname]} useradd(?:\[%{POSINT:[system][auth][pid]}\])?: new user: name=%{DATA:[system][auth][user][add][name]}, UID=%{NUMBER:[system][auth][user][add][uid]}, GID=%{NUMBER:[system][auth][user][add][gid]}, home=%{DATA:[system][auth][user][add][home]}, shell=%{DATA:[system][auth][user][add][shell]}$",
"%{SYSLOGTIMESTAMP:[system][auth][timestamp]} %{SYSLOGHOST:[system][auth][hostname]} %{DATA:[system][auth][program]}(?:\[%{POSINT:[system][auth][pid]}\])?: %{GREEDYMULTILINE:[system][auth][message]}"] }
pattern_definitions => {
"GREEDYMULTILINE"=> "(.|\n)*"
}
remove_field => "message"
}
date {
match => [ "[system][auth][timestamp]", "MMM d HH:mm:ss", "MMM dd HH:mm:ss" ]
}
geoip {
source => "[system][auth][ssh][ip]"
target => "[system][auth][ssh][geoip]"
}
}
else if [fileset][name] == "syslog" {
grok {
match => { "message" => ["%{SYSLOGTIMESTAMP:[system][syslog][timestamp]} %{SYSLOGHOST:[system][syslog][hostname]} %{DATA:[system][syslog][program]}(?:\[%{POSINT:[system][syslog][pid]}\])?: %{GREEDYMULTILINE:[system][syslog][message]}"] }
pattern_definitions => { "GREEDYMULTILINE" => "(.|\n)*" }
remove_field => "message"
}
date {
match => [ "[system][syslog][timestamp]", "MMM d HH:mm:ss", "MMM dd HH:mm:ss" ]
}
}
}
}
Now, we will create a file for output configuration.
nano /etc/logstash/conf.d/30<span class="skimlinks-unlinked">-elasticsearch-output.conf</span>
And at the end insert the following output configuration:
output {
elasticsearch {
hosts => ["localhost:9200"]
manage_template => false
index => "%{[@metadata][beat]}-%{[@metadata][version]}-%{+<span class="skimlinks-unlinked">YYYY.MM.dd</span>}"
}
}
We will test the Logstash configuration with the following command:
sudo -u logstash /usr/share/logstash/bin/logstash --path.settings /etc/logstash -t
If the configuration is successful we will start and enable Logstash.
systemctl start logstash
systemctl enable logstash
Step 5 – Installing and Configuring Filebeat
There are several data shippers called Beats. The main purpose is to collect data from different sources and transport them to Logstash or Elasticsearch.
In this tutorial, we will install Filebeat which will collects and ships log files to ELK Stack.
We will install Filebeat with the following command:
apt install filebeat
Now we need to configure Filebeat. The configuration file is located in /etc/filebeat/filebeat.yml.
Open the file and change it with the following context:
nano /etc/filebeat/filebeat.yml
enabled: true
paths:
    - /var/log/syslog
Also, we need to comment the default “elasticsearch” output and uncomment the Logstash output.
#output.elasticsearch:
# Array of hosts to connect to.
# hosts: ["localhost:9200"]
output.logstash:
# The Logstash hosts
hosts: ["localhost:5044"]
To enable Filebeat modules, we need to edit the “filebeat.reference.yml” configuration file.
nano /etc/filebeat/filebeat.reference.yml
We will enable the syslog system module for Filebeat:
module: system
# Syslog
syslog:
enabled: true
Also, we can enable the modules with the following command:
filebeat modules enable system
To see the list of disabled and enabled modules we will use the following command:
filebeat modules list
The next step is to load the index template into Elasticsearch:
sudo filebeat setup --template -E output.logstash.enabled=false -E 'output.elasticsearch.hosts=["localhost:9200"]'
Filebeat contains some predefined samples that will allow us to visualize Kibana dashboards.
First, we need to create the index pattern and then load the dashboards in Kibana.
We can do this by using the following command:
sudo filebeat setup -e -E output.logstash.enabled=false -E output.elasticsearch.hosts=['localhost:9200'] -E setup.kibana.host=localhost:5601
Now we will start and enable Filebeat:
systemctl start filebeat
systemctl enable filebeat
The configuration and installation of Filebeat has been completed.
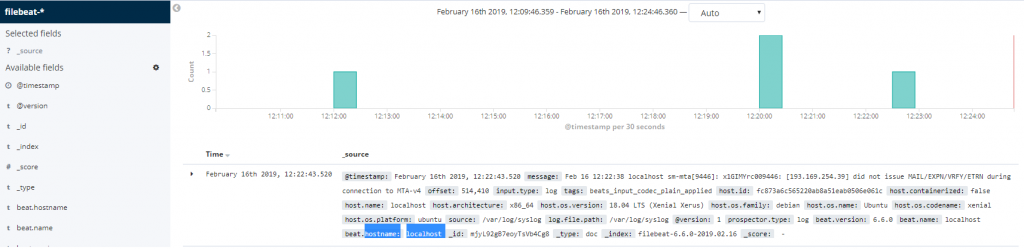
Now, we should open http://server-IP-address in a web browser. We need to click on the ‘Discover’ link. We will select the predefined Filebeat index pattern and this will show us all of the log data.
Congratulations. If you followed our steps closely, you have successfully installed ELK Stack on an Ubuntu 18.04 Cloud VPS.
 Of course, you don’t need to install and configure ELK Stack on Ubuntu 18.04 by yourself if you use one of our Linux Managed Cloud Hosting solutions, in which case you can simply ask our expert Linux admins to setup and configure an ELK Stack on Ubuntu 18.04 for you. They are available 24×7 and will take care of your request immediately.
PS. If you liked this post on how to install ELK Stack on an Ubuntu 18.04 Cloud VPS, please share it with your friends on the social networks using the share shortcuts, or simply leave a reply below. Thank you.
Thank you for such useful insights.