
In this tutorial, we will explain how to install Grafana on AlmaLinux 9 OS.
If you ever doubt what Grafana is and what it is used for, we are here to explain it to you. Grafana is a multi-platform open-source visualization application that provides graphs, charts, and alerts through the web from the server data. Grafana is written in TypeScript and Go and is used by many developers, administrators, hosting companies, regular users and etc. In this tutorial, we are going to install Grafana and show you how to access it via reverse proxy made in the Apache Web server.
This installation is very straightforward and will take up to 20 minutes. Let’s get started!
Prerequisites
- A server with AlmaLinux 9 as OS
- Valid domain pointed to the servers IP address
- User privileges: root or non-root user with sudo privileges
Step 1. Update the System
Before we start with Grafana installation, we need to update the system packages to the latest version available.
sudo dnf update -y && sudo dnf upgrade -y
Step 2. Install Grafana
Before we start with the installation, we need to add first, the Grafana repository since it is not added in AlmaLinux 9 by default. To do that, create the following file:
nano /etc/yum.repos.d/grafana.repo
Paste the following lines of code:
[grafana]
name=grafana
baseurl=https://packages.grafana.com/oss/rpm
repo_gpgcheck=1
enabled=1
gpgcheck=1
gpgkey=https://packages.grafana.com/gpg.key
sslverify=1
sslcacert=/etc/pki/tls/certs/ca-bundle.crt
Save the file, close it, and update the system.
sudo dnf update -y
Allow port 3000 in the firewall. This is the port that is Grafana service is running on.
firewall-cmd --add-port=3000/tcp --permanent
sudo firewall-cmd --reload
Once the system is updated and the port is opened, install Grafana with the following command:
sudo dnf install grafana -y
Start and enable the service after successful installation:
sudo systemctl start grafana-server && sudo systemctl enable grafana-server
To check the status of the server, execute the following command:
sudo systemctl status grafana-server
You should receive the following output:
[root@host ~]# sudo systemctl status grafana-server
● grafana-server.service - Grafana instance
     Loaded: loaded (/usr/lib/systemd/system/grafana-server.service; enabled; vendor preset: disabled)
     Active: active (running) since Thu 2023-02-02 09:33:19 CST; 28s ago
       Docs: http://docs.grafana.org
   Main PID: 1877 (grafana-server)
      Tasks: 11 (limit: 24796)
     Memory: 39.6M
        CPU: 1.310s
     CGroup: /system.slice/grafana-server.service
             └─1877 /usr/sbin/grafana-server --config=/etc/grafana/grafana.ini --pidfile=/var/run/grafana/grafana-server.pid --packaging=rpm cfg:default.paths.logs=/
As we know, the Grafana service is running on port 3000. We can check this by executing the following command:
netstat -tunlp | grep 3000
You should receive the following output:
root@host:~# netstat -tunlp | grep 3000
tcp6       0      0 :::3000                 :::*                    LISTEN      23921/grafana-serve
You should receive the following output:
[root@host ~]# netstat -tunlp | grep 3000
tcp6       0      0 :::3000                 :::*                    LISTEN      1877/grafana-server
You can now access the Grafana monitoring service on the URL: http://YourIPAddress:3000.
This tutorial will not stop here. We will proceed with installing the web server required for reverse proxy and setting up the domain in the virtual host file.
Step 3. Install Apache
To install the Apache web server execute the following command:
sudo dnf install httpd -y
Once installed, start and enable the service.
sudo systemctl enable httpd && sudo systemctl start httpd
Check if the service is up and running:
sudo systemctl status httpd
You should receive the following output:
[root@host ~]# sudo systemctl status httpd
● httpd.service - The Apache HTTP Server
     Loaded: loaded (/usr/lib/systemd/system/httpd.service; enabled; vendor preset: disabled)
    Drop-In: /usr/lib/systemd/system/httpd.service.d
             └─php-fpm.conf
     Active: active (running) since Wed 2023-02-01 16:16:23 CST; 17h ago
       Docs: man:httpd.service(8)
   Main PID: 565 (httpd)
     Status: "Total requests: 626; Idle/Busy workers 100/0;Requests/sec: 0.00983; Bytes served/sec:   7 B/sec"
      Tasks: 213 (limit: 24796)
     Memory: 42.7M
        CPU: 51.447s
     CGroup: /system.slice/httpd.service
             ├─565 /usr/sbin/httpd -DFOREGROUND
             ├─591 /usr/sbin/httpd -DFOREGROUND
             ├─595 /usr/sbin/httpd -DFOREGROUND
             ├─596 /usr/sbin/httpd -DFOREGROUND
             └─599 /usr/sbin/httpd -DFOREGROUND

Feb 01 16:16:23 host.test.vps systemd[1]: Starting The Apache HTTP Server...
Feb 01 16:16:23 host.test.vps systemd[1]: Started The Apache HTTP Server.
Feb 01 16:16:23 host.test.vps httpd[565]: Server configured, listening on: port 80
Step 4. Create Apache Virtual Host File and Reverse Proxy
We need to create an Apache virtual host configuration file in order can access Grafana via the domain name:
sudo nano /etc/httpd/conf.d/grafana.conf
Paste the following lines of code:
<VirtualHost *:80>
     ServerName yourdomain.com
     DocumentRoot /var/www/html/
     <Directory /var/www/html/>
          Options FollowSymlinks
          AllowOverride All
          Require all granted
     </Directory>

    ProxyRequests off
    ProxyPass / http://127.0.0.1:3000/
    ProxyPassReverse / http://127.0.0.1:3000/

     ErrorLog /var/log/httpd/yourdomain.com_error.log
     CustomLog /var/log/httpd/yourdomain.com.log combined
</VirtualHost>
Save the file, close it, and check the syntax of the Apache configuration file.
httpd -t
You should get this output:
[root@host project]# httpd -t
Syntax OK
Restart the httpd.service.
sudo systemctl restart httpd
Finally, you can access the Grafana via the domain name at http://Yourdomain.com
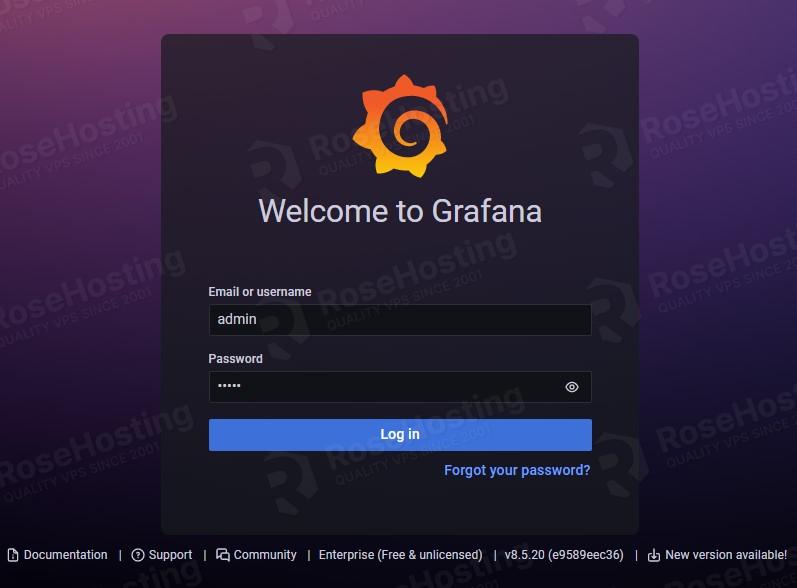
On fresh Grafana installation, the username is admin, and the password is admin.
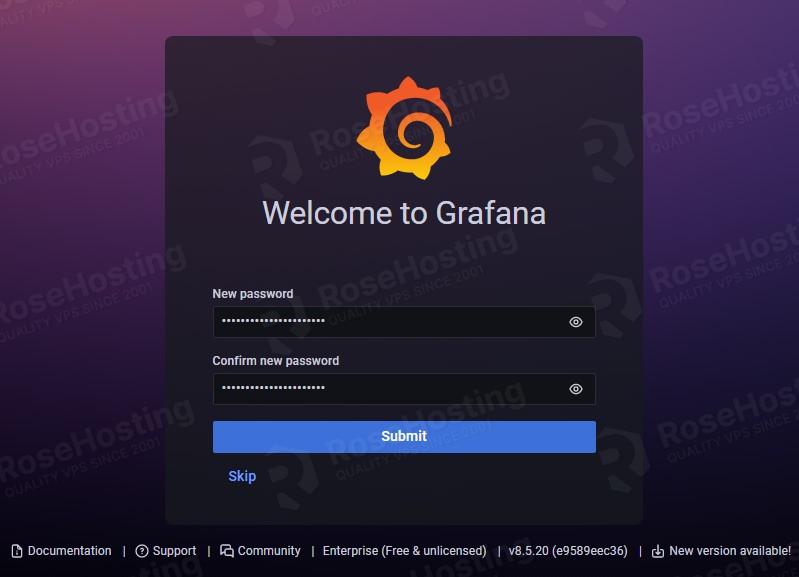
You need to set a new strong password with more characters and numbers.
We hope that our step-by-step guide on installing Grafana on AlmaLinux 9 has made the process much clearer and easier for you. Now, we’d love to hear from you:
Do you have any concerns about the steps or need more detailed information? Is there any specific topic or how-to guide you’re keen to see us delve into next?
We’d appreciate your feedback in the comments below.